 Azərbaycanca (AZ)
 Deutsch (DE)
 English (US)
 Қазақша (KZ)
 Lietuva (LT)
 සිංහල (LK)
 Türkçe (TR)
 O'zbekcha (UZ)
 中國人 (CN)
Greater Boston is the metropolitan region of New England encompassing the municipality of Boston, the capital of the U.S. state of Massachusetts and the most populous city in New England, and its surrounding areas, home to 4,941,632. The most stringent definition of the region, used by the Metropolitan Area Planning Council, consists of most of the eastern third of mainland Massachusetts, excluding the Merrimack Valley and most of Southeastern Massachusetts, though most definitions (including the U.S. Census definition) include much of these areas and portions of southern New Hampshire.
Greater Boston Boston-Cambridge-Newton, MA-NH Metropolitan Statistical Area | ||
|---|---|---|
Metropolitan statistical area | ||
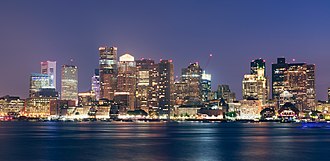 Boston in July 2015 | ||
 Interactive Map of Boston–Worcester–Providence, MA–RI–NH CSA
| ||
| Country | ||
| State | ||
| Principal cities |
| |
| Population (2024) | ||
• Total | 8,493,824 (CSA) 4,941,632 (MSA) | |
| • Rank |
| |
| GDP | ||
| • Total | $610.486 billion (2023) | |
| Time zone | UTC−5 (EST) | |
| • Summer (DST) | UTC−4 (EDT) | |
| Area codes | 617, 781, 857, 339, 978, 508, 351, 774, 603, 401 | |
While the city of Boston covers 48.4 square miles (125 km2) and has 675,647 residents as of the 2020 census, the urbanization has extended well into surrounding areas and the Combined Statistical Area (CSA in the rest of the document), which includes the Providence, Rhode Island, Manchester, New Hampshire, Cape Cod and Worcester areas, has a population of more than 8.4 million people, making it one of the most populous such regions in the U.S.
Some of Greater Boston's most well-known contributions involve the region's higher education and medical institutions. Greater Boston has been influential upon American history and industry. The region and the state of Massachusetts are global leaders in biotechnology, health care, engineering, higher education, finance, and maritime trade.
Greater Boston is ranked tenth in population among US metropolitan statistical areas, home to 4,941,632 people as of the 2020 United States census, and seventh among combined statistical areas, with a population of 8,493,824. The area has hosted many people and sites significant to American culture and history, particularly American literature, politics, and the American Revolution.
Plymouth was the site of the first colony in New England, founded in 1620 by the Pilgrims, passengers of the Mayflower. In 1692, the town of Salem and surrounding areas experienced one of America's most infamous cases of mass hysteria, the Salem witch trials. In the late 18th century, Boston became known as the "Cradle of Liberty" for the agitation there that led to the American Revolution.
The Greater Boston region has played a powerful scientific, commercial, and cultural role in the history of the United States. Before the American Civil War, the region was a center for the abolitionist, temperance, and transcendentalist movements. In 2004, Massachusetts became the first U.S. state to legally recognize same-sex marriage as a result of the decision of the Massachusetts Supreme Judicial Court in Boston. Many prominent American political dynasties have hailed from the Boston region, including the Adams and Kennedy families.
Harvard University in Cambridge is the oldest institution of higher learning in the United States, founded in 1636, with the largest financial endowment of any university, and whose Law School has spawned a contemporaneous majority of United States Supreme Court Justices. Kendall Square in Cambridge has been called "the most innovative square mile on the planet", in reference to the high concentration of entrepreneurial start-ups and quality of innovation which have emerged in the vicinity of the square since 2010. Both Harvard University and the Massachusetts Institute of Technology, also in Cambridge, have been ranked among the most highly regarded academic institutions in the world.
Geography
Boundary definitions
Metropolitan Area
The most restrictive definition of the Greater Boston area is the region administered by the Metropolitan Area Planning Council. The MAPC is a regional planning organization created by the Massachusetts legislature to oversee transportation infrastructure and economic development concerns in the Boston area. The MAPC includes 101 cities and towns that are grouped into eight subregions. These include most of the area within the region's outer circumferential highway, I-495. In 2013, the population of the MAPC district was 3.2 million, which was 48% of the total population of Massachusetts, in an area of 1,422 square miles (3,680 km2), of which 39% is forested and an additional 11% is water, wetland, or other open space.
The cities and towns included in this definition are:
- Acton
- Arlington
- Ashland
- Bedford
- Bellingham
- Belmont
- Beverly
- Bolton
- Boston
- Boxborough
- Braintree
- Brookline
- Burlington
- Cambridge
- Canton
- Carlisle
- Chelsea
- Cohasset
- Concord
- Danvers
- Dedham
- Dover
- Duxbury
- Essex
- Everett
- Foxborough
- Framingham
- Franklin
- Gloucester
- Hamilton
- Hanover
- Hingham
- Holbrook
- Holliston
- Hopkinton
- Hudson
- Hull
- Ipswich
- Lexington
- Lincoln
- Littleton
- Lynn
- Lynnfield
- Malden
- Manchester-by-the-Sea
- Marblehead
- Marlborough
- Marshfield
- Maynard
- Medfield
- Medford
- Medway
- Melrose
- Middleton
- Milford
- Millis
- Milton
- Nahant
- Natick
- Needham
- Newton
- Norfolk
- North Reading
- Norwell
- Norwood
- Peabody
- Pembroke
- Quincy
- Randolph
- Reading
- Revere
- Rockland
- Rockport
- Salem
- Saugus
- Scituate
- Sharon
- Sherborn
- Somerville
- Southborough
- Stoneham
- Stoughton
- Stow
- Sudbury
- Swampscott
- Topsfield
- Wakefield
- Walpole
- Waltham
- Watertown
- Wayland
- Wellesley
- Wenham
- Weston
- Westwood
- Weymouth
- Wilmington
- Winchester
- Winthrop
- Woburn
- Wrentham
New England City and Town Area
Two definitions are used by the United States Census to define the Boston–Cambridge–Newton, MA–NH Metro Area or Boston–Cambridge–Newton, MA–NH Metropolitan NECTA, which is defined as a New England City and Town Area. The metro area definition is based on counties, while the NECTA definition is based on city and town boundaries. Counties included in the county-based definition include:
- Essex County, Massachusetts
- Middlesex County, Massachusetts
- Norfolk County, Massachusetts
- Plymouth County, Massachusetts
- Suffolk County, Massachusetts
- Rockingham County, New Hampshire
- Strafford County, New Hampshire
The NECTA definition includes all of the communities from the MAPC definition, as well as the Merrimack Valley communities, parts of southern New Hampshire (northward to Milford and Hampton, and the Taunton area.
| Census | Pop. | Note | %± |
|---|---|---|---|
| 1850 | 650,357 | — | |
| 1860 | 830,998 | 27.8% | |
| 1870 | 978,346 | 17.7% | |
| 1880 | 1,205,439 | 23.2% | |
| 1890 | 1,515,684 | 25.7% | |
| 1900 | 1,890,122 | 24.7% | |
| 1910 | 2,260,762 | 19.6% | |
| 1920 | 2,563,123 | 13.4% | |
| 1930 | 2,866,567 | 11.8% | |
| 1940 | 2,926,650 | 2.1% | |
| 1950 | 3,186,970 | 8.9% | |
| 1960 | 3,516,435 | 10.3% | |
| 1970 | 3,918,092 | 11.4% | |
| 1980 | 3,938,585 | 0.5% | |
| 1990 | 4,133,895 | 5.0% | |
| 2000 | 4,391,344 | 6.2% | |
| 2010 | 4,552,402 | 3.7% | |
| 2020 | 4,941,632 | 8.5% | |
| 2024 (est.) | 5,025,517 | 1.7% | |
| US Census | |||

Combined Statistical Area
The widest definition of the metropolitan area based on commuting patterns, is defined by the U.S. Census as the Boston–Worcester–Providence combined statistical area. This area consists of the following counties in Massachusetts, Rhode Island, and New Hampshire:
- Massachusetts
- Barnstable County, Massachusetts
- Bristol County, Massachusetts
- Essex County, Massachusetts
- Middlesex County, Massachusetts
- Norfolk County, Massachusetts
- Plymouth County, Massachusetts
- Suffolk County, Massachusetts
- Worcester County, Massachusetts
- New Hampshire
- Belknap County, New Hampshire
- Hillsborough County, New Hampshire
- Merrimack County, New Hampshire
- Rockingham County, New Hampshire
- Strafford County, New Hampshire
- Rhode Island
- Bristol County, Rhode Island
- Kent County, Rhode Island
- Newport County, Rhode Island
- Providence County, Rhode Island
- Washington County, Rhode Island
The total population for the extended region was estimated at 7,493,824 at the 2020 census.[citation needed]
Subregions
- Massachusetts
- Central Massachusetts
- Montachusett-North County
- South County
- Blackstone River Valley
- North Shore
- Cape Ann
- Merrimack Valley
- MetroWest
- Southeastern Massachusetts
- Cape Cod
- South Coast
- South Shore
- Central Massachusetts
- New Hampshire
- Lakes Region
- Seacoast
- Rhode Island
- Blackstone Valley
- East Bay
Climate
The Boston area has humid continental climates (Dfa and Dfb under the Köppen climate classification system), with high humidity and precipitation year-round.
| Climate data for Concord Municipal Airport, New Hampshire (1991−2020 normals, extremes 1868–present) | |||||||||||||
|---|---|---|---|---|---|---|---|---|---|---|---|---|---|
| Month | Jan | Feb | Mar | Apr | May | Jun | Jul | Aug | Sep | Oct | Nov | Dec | Year |
| Record high °F (°C) | 72 (22) | 74 (23) | 89 (32) | 95 (35) | 98 (37) | 101 (38) | 102 (39) | 101 (38) | 98 (37) | 92 (33) | 80 (27) | 73 (23) | 102 (39) |
| Mean maximum °F (°C) | 52.4 (11.3) | 54.3 (12.4) | 65.6 (18.7) | 81.6 (27.6) | 89.6 (32.0) | 92.8 (33.8) | 93.8 (34.3) | 92.4 (33.6) | 89.0 (31.7) | 79.0 (26.1) | 68.6 (20.3) | 56.9 (13.8) | 96.1 (35.6) |
| Mean daily maximum °F (°C) | 31.6 (−0.2) | 34.8 (1.6) | 43.6 (6.4) | 57.5 (14.2) | 69.3 (20.7) | 77.8 (25.4) | 83.0 (28.3) | 81.7 (27.6) | 73.7 (23.2) | 60.9 (16.1) | 48.4 (9.1) | 37.1 (2.8) | 58.3 (14.6) |
| Daily mean °F (°C) | 22.3 (−5.4) | 24.7 (−4.1) | 33.4 (0.8) | 45.4 (7.4) | 56.7 (13.7) | 65.8 (18.8) | 71.1 (21.7) | 69.5 (20.8) | 61.4 (16.3) | 49.3 (9.6) | 38.6 (3.7) | 28.3 (−2.1) | 47.2 (8.4) |
| Mean daily minimum °F (°C) | 12.9 (−10.6) | 14.7 (−9.6) | 23.3 (−4.8) | 33.3 (0.7) | 44.1 (6.7) | 53.7 (12.1) | 59.2 (15.1) | 57.2 (14.0) | 49.0 (9.4) | 37.8 (3.2) | 28.7 (−1.8) | 19.5 (−6.9) | 36.1 (2.3) |
| Mean minimum °F (°C) | −9.2 (−22.9) | −7.2 (−21.8) | 1.6 (−16.9) | 19.2 (−7.1) | 29.2 (−1.6) | 39.0 (3.9) | 47.1 (8.4) | 44.1 (6.7) | 32.1 (0.1) | 22.1 (−5.5) | 11.8 (−11.2) | −0.9 (−18.3) | −12.4 (−24.7) |
| Record low °F (°C) | −35 (−37) | −37 (−38) | −20 (−29) | 4 (−16) | 21 (−6) | 26 (−3) | 33 (1) | 29 (−2) | 20 (−7) | 10 (−12) | −17 (−27) | −24 (−31) | −37 (−38) |
| Average precipitation inches (mm) | 2.80 (71) | 2.75 (70) | 3.28 (83) | 3.43 (87) | 3.47 (88) | 3.77 (96) | 3.62 (92) | 3.63 (92) | 3.63 (92) | 4.43 (113) | 3.44 (87) | 3.70 (94) | 41.95 (1,066) |
| Average snowfall inches (cm) | 17.1 (43) | 16.9 (43) | 13.6 (35) | 2.5 (6.4) | 0.0 (0.0) | 0.0 (0.0) | 0.0 (0.0) | 0.0 (0.0) | 0.0 (0.0) | 0.8 (2.0) | 2.5 (6.4) | 14.3 (36) | 67.7 (172) |
| Average extreme snow depth inches (cm) | 11.9 (30) | 15.3 (39) | 13.9 (35) | 4.0 (10) | 0.0 (0.0) | 0.0 (0.0) | 0.0 (0.0) | 0.0 (0.0) | 0.0 (0.0) | 0.6 (1.5) | 2.0 (5.1) | 9.1 (23) | 19.8 (50) |
| Average precipitation days (≥ 0.01 in) | 11.2 | 10.0 | 11.5 | 11.4 | 12.4 | 12.8 | 10.9 | 9.9 | 9.3 | 10.6 | 10.8 | 12.0 | 132.8 |
| Average snowy days (≥ 0.1 in) | 8.1 | 7.6 | 5.2 | 1.3 | 0.0 | 0.0 | 0.0 | 0.0 | 0.0 | 0.2 | 1.6 | 6.3 | 30.3 |
| Average relative humidity (%) | 67.9 | 66.0 | 64.8 | 62.0 | 65.0 | 70.9 | 71.8 | 74.5 | 76.3 | 72.8 | 73.3 | 72.3 | 69.8 |
| Average dew point °F (°C) | 10.2 (−12.1) | 12.0 (−11.1) | 20.8 (−6.2) | 29.8 (−1.2) | 42.1 (5.6) | 53.8 (12.1) | 58.8 (14.9) | 57.9 (14.4) | 50.5 (10.3) | 38.3 (3.5) | 28.8 (−1.8) | 16.7 (−8.5) | 35.0 (1.7) |
| Mean monthly sunshine hours | 162.8 | 171.8 | 210.5 | 223.2 | 258.4 | 274.3 | 295.8 | 261.9 | 214.7 | 183.4 | 127.8 | 134.8 | 2,519.4 |
| Percentage possible sunshine | 56 | 58 | 57 | 56 | 57 | 60 | 64 | 61 | 57 | 54 | 44 | 48 | 56 |
| Average ultraviolet index | 1 | 2 | 4 | 5 | 7 | 8 | 8 | 7 | 6 | 3 | 2 | 1 | 5 |
| Source 1: NOAA (relative humidity , dew points and sun 1961–1990) | |||||||||||||
| Source 2: Weather Atlas (UV) | |||||||||||||
| Month | Jan | Feb | Mar | Apr | May | Jun | Jul | Aug | Sep | Oct | Nov | Dec | Year |
|---|---|---|---|---|---|---|---|---|---|---|---|---|---|
| Record high °F (°C) | 74 (23) | 73 (23) | 89 (32) | 94 (34) | 97 (36) | 102 (39) | 104 (40) | 102 (39) | 102 (39) | 90 (32) | 83 (28) | 76 (24) | 104 (40) |
| Mean maximum °F (°C) | 58.3 (14.6) | 57.9 (14.4) | 67.0 (19.4) | 79.9 (26.6) | 88.1 (31.2) | 92.2 (33.4) | 95.0 (35.0) | 93.7 (34.3) | 88.9 (31.6) | 79.6 (26.4) | 70.2 (21.2) | 61.2 (16.2) | 96.4 (35.8) |
| Mean daily maximum °F (°C) | 36.8 (2.7) | 39.0 (3.9) | 45.5 (7.5) | 56.4 (13.6) | 66.5 (19.2) | 76.2 (24.6) | 82.1 (27.8) | 80.4 (26.9) | 73.1 (22.8) | 62.1 (16.7) | 51.6 (10.9) | 42.2 (5.7) | 59.3 (15.2) |
| Daily mean °F (°C) | 29.9 (−1.2) | 31.8 (−0.1) | 38.3 (3.5) | 48.6 (9.2) | 58.4 (14.7) | 68.0 (20.0) | 74.1 (23.4) | 72.7 (22.6) | 65.6 (18.7) | 54.8 (12.7) | 44.7 (7.1) | 35.7 (2.1) | 51.9 (11.1) |
| Mean daily minimum °F (°C) | 23.1 (−4.9) | 24.6 (−4.1) | 31.1 (−0.5) | 40.8 (4.9) | 50.3 (10.2) | 59.7 (15.4) | 66.0 (18.9) | 65.1 (18.4) | 58.2 (14.6) | 47.5 (8.6) | 37.9 (3.3) | 29.2 (−1.6) | 44.5 (6.9) |
| Mean minimum °F (°C) | 4.8 (−15.1) | 8.3 (−13.2) | 15.6 (−9.1) | 31.0 (−0.6) | 41.2 (5.1) | 49.7 (9.8) | 58.6 (14.8) | 57.7 (14.3) | 46.7 (8.2) | 35.1 (1.7) | 24.4 (−4.2) | 13.1 (−10.5) | 2.6 (−16.3) |
| Record low °F (°C) | −13 (−25) | −18 (−28) | −8 (−22) | 11 (−12) | 31 (−1) | 41 (5) | 50 (10) | 46 (8) | 34 (1) | 25 (−4) | −2 (−19) | −17 (−27) | −18 (−28) |
| Average precipitation inches (mm) | 3.39 (86) | 3.21 (82) | 4.17 (106) | 3.63 (92) | 3.25 (83) | 3.89 (99) | 3.27 (83) | 3.23 (82) | 3.56 (90) | 4.03 (102) | 3.66 (93) | 4.30 (109) | 43.59 (1,107) |
| Average snowfall inches (cm) | 14.3 (36) | 14.4 (37) | 9.0 (23) | 1.6 (4.1) | 0.0 (0.0) | 0.0 (0.0) | 0.0 (0.0) | 0.0 (0.0) | 0.0 (0.0) | 0.2 (0.51) | 0.7 (1.8) | 9.0 (23) | 49.2 (125) |
| Average precipitation days (≥ 0.01 in) | 11.8 | 10.6 | 11.6 | 11.6 | 11.8 | 10.9 | 9.4 | 9.0 | 9.0 | 10.5 | 10.3 | 11.9 | 128.4 |
| Average snowy days (≥ 0.1 in) | 6.6 | 6.2 | 4.4 | 0.8 | 0.0 | 0.0 | 0.0 | 0.0 | 0.0 | 0.2 | 0.6 | 4.2 | 23.0 |
| Average relative humidity (%) | 62.3 | 62.0 | 63.1 | 63.0 | 66.7 | 68.5 | 68.4 | 70.8 | 71.8 | 68.5 | 67.5 | 65.4 | 66.5 |
| Average dew point °F (°C) | 19.8 (−6.8) | 20.3 (−6.5) | 26.2 (−3.2) | 35.1 (1.7) | 46.2 (7.9) | 56.3 (13.5) | 62.1 (16.7) | 61.7 (16.5) | 55.9 (13.3) | 45.0 (7.2) | 34.5 (1.4) | 25.9 (−3.4) | 40.8 (4.9) |
| Mean monthly sunshine hours | 163.4 | 168.4 | 213.7 | 227.2 | 267.3 | 286.5 | 300.9 | 277.3 | 237.1 | 206.3 | 143.2 | 142.3 | 2,633.6 |
| Percentage possible sunshine | 56 | 57 | 58 | 57 | 59 | 63 | 65 | 64 | 63 | 60 | 49 | 50 | 59 |
| Average ultraviolet index | 1 | 2 | 4 | 5 | 7 | 8 | 8 | 8 | 6 | 4 | 2 | 1 | 5 |
| Source 1: NOAA (relative humidity, and sun 1961−1990) | |||||||||||||
| Source 2: Weather Atlas (UV) | |||||||||||||
| Climate data for Boston, Massachusetts | |||||||||||||
|---|---|---|---|---|---|---|---|---|---|---|---|---|---|
| Month | Jan | Feb | Mar | Apr | May | Jun | Jul | Aug | Sep | Oct | Nov | Dec | Year |
| Average sea temperature °F (°C) | 41.3 (5.2) | 38.1 (3.4) | 38.4 (3.5) | 43.1 (6.2) | 49.2 (9.5) | 58.4 (14.7) | 65.7 (18.7) | 67.9 (20.0) | 64.8 (18.2) | 59.4 (15.3) | 52.3 (11.3) | 46.6 (8.2) | 52.1 (11.2) |
| Source: Weather Atlas | |||||||||||||
| Month | Jan | Feb | Mar | Apr | May | Jun | Jul | Aug | Sep | Oct | Nov | Dec | Year |
|---|---|---|---|---|---|---|---|---|---|---|---|---|---|
| Record high °F (°C) | 70 (21) | 72 (22) | 90 (32) | 98 (37) | 96 (36) | 100 (38) | 102 (39) | 104 (40) | 100 (38) | 88 (31) | 81 (27) | 77 (25) | 104 (40) |
| Mean maximum °F (°C) | 58.7 (14.8) | 57.9 (14.4) | 67.1 (19.5) | 79.3 (26.3) | 87.2 (30.7) | 91.5 (33.1) | 94.8 (34.9) | 92.7 (33.7) | 87.6 (30.9) | 78.9 (26.1) | 70.1 (21.2) | 61.5 (16.4) | 96.6 (35.9) |
| Mean daily maximum °F (°C) | 38.3 (3.5) | 40.5 (4.7) | 47.7 (8.7) | 58.9 (14.9) | 68.9 (20.5) | 77.7 (25.4) | 83.6 (28.7) | 82.2 (27.9) | 74.8 (23.8) | 63.8 (17.7) | 53.2 (11.8) | 43.4 (6.3) | 61.1 (16.2) |
| Daily mean °F (°C) | 30.2 (−1.0) | 32.0 (0.0) | 38.9 (3.8) | 49.3 (9.6) | 59.1 (15.1) | 68.2 (20.1) | 74.4 (23.6) | 73.0 (22.8) | 65.6 (18.7) | 54.4 (12.4) | 44.5 (6.9) | 35.5 (1.9) | 52.1 (11.2) |
| Mean daily minimum °F (°C) | 22.1 (−5.5) | 23.5 (−4.7) | 30.2 (−1.0) | 39.6 (4.2) | 49.2 (9.6) | 58.8 (14.9) | 65.2 (18.4) | 63.9 (17.7) | 56.5 (13.6) | 45.1 (7.3) | 35.8 (2.1) | 27.6 (−2.4) | 43.1 (6.2) |
| Mean minimum °F (°C) | 4.1 (−15.5) | 7.4 (−13.7) | 15.1 (−9.4) | 28.5 (−1.9) | 38.1 (3.4) | 47.2 (8.4) | 56.2 (13.4) | 54.3 (12.4) | 43.1 (6.2) | 31.7 (−0.2) | 21.8 (−5.7) | 12.3 (−10.9) | 2.0 (−16.7) |
| Record low °F (°C) | −13 (−25) | −17 (−27) | 1 (−17) | 11 (−12) | 29 (−2) | 39 (4) | 48 (9) | 40 (4) | 32 (0) | 20 (−7) | 6 (−14) | −12 (−24) | −17 (−27) |
| Average precipitation inches (mm) | 3.96 (101) | 3.44 (87) | 4.90 (124) | 4.29 (109) | 3.37 (86) | 3.81 (97) | 2.91 (74) | 3.59 (91) | 4.17 (106) | 4.18 (106) | 4.27 (108) | 4.65 (118) | 47.54 (1,208) |
| Average snowfall inches (cm) | 10.3 (26) | 10.5 (27) | 6.4 (16) | 0.6 (1.5) | 0.0 (0.0) | 0.0 (0.0) | 0.0 (0.0) | 0.0 (0.0) | 0.0 (0.0) | 0.2 (0.51) | 1.0 (2.5) | 7.6 (19) | 36.6 (93) |
| Average precipitation days (≥ 0.01 in) | 11.2 | 10.3 | 11.6 | 11.7 | 12.2 | 10.8 | 9.3 | 9.1 | 9.1 | 10.2 | 9.6 | 11.9 | 127.0 |
| Average snowy days (≥ 0.1 in) | 5.7 | 5.4 | 3.7 | 0.4 | 0.0 | 0.0 | 0.0 | 0.0 | 0.0 | 0.1 | 0.6 | 3.4 | 19.3 |
| Average relative humidity (%) | 63.9 | 63.0 | 62.9 | 61.4 | 66.6 | 70.1 | 71.0 | 72.5 | 73.0 | 70.2 | 68.9 | 67.0 | 67.5 |
| Average dew point °F (°C) | 16.3 (−8.7) | 17.4 (−8.1) | 25.0 (−3.9) | 33.1 (0.6) | 45.0 (7.2) | 55.6 (13.1) | 61.5 (16.4) | 61.0 (16.1) | 53.8 (12.1) | 42.6 (5.9) | 33.3 (0.7) | 22.1 (−5.5) | 38.9 (3.8) |
| Mean monthly sunshine hours | 171.7 | 172.6 | 215.6 | 225.1 | 254.9 | 274.1 | 290.6 | 262.8 | 233.0 | 208.7 | 148.0 | 148.6 | 2,605.7 |
| Percentage possible sunshine | 58 | 58 | 58 | 56 | 57 | 60 | 63 | 61 | 62 | 61 | 50 | 52 | 58 |
| Average ultraviolet index | 1 | 2 | 4 | 6 | 7 | 8 | 8 | 8 | 6 | 4 | 2 | 1 | 5 |
| Source 1: NOAA (relative humidity, dew point, and sun 1961–1990) | |||||||||||||
| Source 2: Weather Atlas | |||||||||||||
| Climate data for Providence | |||||||||||||
|---|---|---|---|---|---|---|---|---|---|---|---|---|---|
| Month | Jan | Feb | Mar | Apr | May | Jun | Jul | Aug | Sep | Oct | Nov | Dec | Year |
| Average sea temperature °F (°C) | 41.4 (5.2) | 38.1 (3.4) | 38.7 (3.8) | 44.1 (6.7) | 50.9 (10.5) | 59.6 (15.3) | 67.0 (19.4) | 69.3 (20.7) | 66.7 (19.3) | 61.6 (16.4) | 54.2 (12.3) | 47.7 (8.8) | 53.3 (11.8) |
| Source: Weather Atlas | |||||||||||||
Demographics
Greater Boston has a sizable Jewish community, estimated at between 210,000 people, and 261,000 or 5–6% of the Greater Boston metro population, compared with about 2% for the nation as a whole. Contrary to national trends, the number of Jews in Greater Boston has been growing, fueled by the fact that 60% of children in Jewish mixed-faith families are raised Jewish, compared with roughly one in three nationally. The 2020 PRRI Atlas found that 35% of the Boston metro area identified as Protestant while 26% identified as Catholic.
The City of Boston also has one of the largest LGBT populations per capita. It ranks fifth of all major cities in the country (behind San Francisco, and slightly behind Seattle, Atlanta, and Minneapolis), with 12.3% of the city identifying as gay, lesbian, or bisexual.
| County | 2021 Estimate | 2020 Census | Change | Area | Density |
|---|---|---|---|---|---|
| Middlesex County, Massachusetts | 1,614,742 | 1,632,002 | −1.06% | 817.82 sq mi (2,118.1 km2) | 1,974/sq mi (762/km2) |
| Essex County, Massachusetts | 807,074 | 809,829 | −0.34% | 492.56 sq mi (1,275.7 km2) | 1,639/sq mi (633/km2) |
| Suffolk County, Massachusetts | 771,245 | 797,936 | −3.35% | 58.15 sq mi (150.6 km2) | 13,263/sq mi (5,121/km2) |
| Norfolk County, Massachusetts | 724,505 | 725,981 | −0.20% | 396.11 sq mi (1,025.9 km2) | 1,829/sq mi (706/km2) |
| Plymouth County, Massachusetts | 533,003 | 530,819 | +0.41% | 659.07 sq mi (1,707.0 km2) | 809/sq mi (312/km2) |
| Rockingham County, New Hampshire | 316,947 | 314,176 | +0.88% | 694.72 sq mi (1,799.3 km2) | 456/sq mi (176/km2) |
| Strafford County, New Hampshire | 132,416 | 130,889 | +1.17% | 368.97 sq mi (955.6 km2) | 359/sq mi (139/km2) |
| Total | 4,899,932 | 4,941,642 | −0.84% | 3,487.40 sq mi (9,032.3 km2) | 1,405/sq mi (542/km2) |
The 40 most diverse Census tracts in the Boston CSA:
| Rank | City or neighborhood | Census tract | Population | % White | % Black | % Hispanic | % Asian | % multiracial or other |
|---|---|---|---|---|---|---|---|---|
| 1 | Dorchester | 916 | 3,138 | 12 | 32 | 15 | 26 | 14 |
| 2 | Pawtucket | 161 | 4,607 | 28 | 24 | 28 | 1 | 18 |
| 3 | Pawtucket | 151 | 4,472 | 24 | 24 | 29 | 1 | 23 |
| 4 | Pawtucket | 164 | 4,938 | 29 | 26 | 21 | 2 | 20 |
| 5 | Dorchester | 912 | 3,234 | 30 | 24 | 22 | 6 | 18 |
| 6 | Dorchester | 92101 | 6,451 | 30 | 22 | 11 | 31 | 6 |
| 7 | Brockton | 5115 | 4,308 | 21 | 32 | 13 | 2 | 32 |
| 8 | Brockton | 511 | 3,040 | 28 | 33 | 15 | 1 | 24 |
| 9 | New Bedford | 6519 | 1,942 | 26 | 11 | 33 | 1 | 29 |
| 10 | Mission Hill | 80801 | 3,885 | 32 | 20 | 35 | 10 | 2 |
| 11 | Pawtucket | 154 | 2,258 | 35 | 20 | 35 | 0 | 11 |
| 12 | Brockton | 5114 | 3,716 | 24 | 36 | 14 | 2 | 23 |
| 13 | Brockton | 5109 | 2,531 | 24 | 36 | 16 | 1 | 24 |
| 14 | Brockton | 5103 | 3,798 | 23 | 38 | 15 | 2 | 24 |
| 15 | Brockton | 5104 | 3,706 | 19 | 38 | 15 | 2 | 25 |
| 16 | Dorchester | 90901 | 3,730 | 38 | 18 | 21 | 20 | 4 |
| 17 | Worcester | 733 | 3,762 | 38 | 10 | 37 | 12 | 4 |
| 18 | Providence | 26 | 3,098 | 23 | 22 | 39 | 10 | 6 |
| 19 | Malden | 3415 | 4,780 | 39 | 23 | 14 | 19 | 5 |
| 20 | Cambridge | 3524 | 2,126 | 27 | 39 | 16 | 12 | 5 |
| 21 | South End | 71202 | 3,131 | 39 | 19 | 24 | 15 | 3 |
| 22 | Brockton | 511301 | 5,334 | 39 | 31 | 11 | 2 | 17 |
| 23 | Providence | 15 | 2,994 | 28 | 13 | 41 | 14 | 4 |
| 24 | South Boston | 61 | 3,098 | 41 | 15 | 29 | 11 | 4 |
| 25 | Lynn | 2072 | 2,939 | 30 | 12 | 42 | 13 | 2 |
| 26 | Cambridge | 3549 | 6,058 | 35 | 30 | 9 | 20 | 5 |
| 27 | South Boston | 61101 | 2,232 | 20 | 21 | 42 | 14 | 2 |
| 28 | Brockton | 5116 | 7,211 | 42 | 29 | 10 | 2 | 16 |
| 29 | Roxbury | 801 | 3,350 | 15 | 43 | 28 | 1 | 11 |
| 30 | Lowell | 3114 | 5,986 | 44 | 11 | 14 | 26 | 5 |
| 31 | Brockton | 5108 | 6,339 | 18 | 44 | 12 | 2 | 22 |
| 32 | Mission Hill | 81001 | 4,890 | 45 | 14 | 19 | 19 | 2 |
| 33 | Malden | 3418 | 6,554 | 46 | 20 | 13 | 16 | 5 |
| 34 | South Boston | 607 | 1,893 | 19 | 20 | 46 | 10 | 5 |
| 35 | Brockton | 5107 | 5,656 | 46 | 31 | 8 | 4 | 11 |
| 36 | Brockton | 5112 | 4,849 | 47 | 26 | 11 | 1 | 13 |
| 37 | Somerville | 351404 | 4,289 | 47 | 7 | 22 | 13 | 11 |
| 38 | Lynn | 2071 | 3,513 | 18 | 11 | 48 | 19 | 3 |
| 39 | Framingham | 383101 | 4,923 | 23 | 10 | 48 | 1 | 18 |
| 40 | Mission Hill | 811 | 4,091 | 48 | 21 | 15 | 13 | 2 |
The 40 census tracts in the Boston CSA with the highest percentage of residents who identify as Hispanic or Latino:
| Rank | City or Neighborhood | Census Tract | Population | % Hispanic or Latino |
|---|---|---|---|---|
| 1 | Lawrence | 2525 | 3,810 | 94 |
| 2 | Lawrence | 2509 | 2,193 | 93 |
| 3 | Lawrence | 2504 | 3,858 | 90 |
| 4 | Lawrence | 2503 | 2,101 | 89 |
| 5 | Lawrence | 2513 | 3,721 | 89 |
| 6 | Lawrence | 2512 | 1,356 | 86 |
| 7 | Lawrence | 2507 | 4,756 | 86 |
| 8 | Lawrence | 251 | 1,782 | 85 |
| 9 | Chelsea | 1602 | 4,043 | 83 |
| 10 | Lawrence | 2506 | 5,599 | 83 |
| 11 | Lawrence | 2514 | 5,053 | 77 |
| 12 | Chelsea | 160101 | 7,551 | 76 |
| 13 | Lawrence | 2501 | 2,329 | 75 |
| 14 | Lawrence | 2516 | 5,977 | 74 |
| 15 | Lawrence | 2511 | 2,937 | 73 |
| 16 | Lawrence | 2502 | 5,524 | 72 |
| 17 | Chelsea | 1604 | 2,716 | 71 |
| 18 | Chelsea | 160501 | 5,604 | 71 |
| 19 | Providence | 16 | 8,540 | 70 |
| 20 | Lawrence | 2515 | 6,149 | 70 |
| 21 | Worcester | 732001 | 3,327 | 67 |
| 22 | East Boston | 506 | 2,063 | 67 |
| 23 | East Boston | 502 | 5,231 | 66 |
| 24 | East Boston | 507 | 4,504 | 65 |
| 25 | East Boston | 50901 | 4,165 | 65 |
| 26 | Providence | 2 | 6,452 | 64 |
| 27 | Providence | 4 | 3,761 | 64 |
| 28 | Providence | 14 | 6,693 | 63 |
| 29 | Providence | 5 | 3,040 | 63 |
| 30 | Central Falls | 11 | 5,534 | 63 |
| 31 | Lawrence | 2508 | 6,932 | 63 |
| 32 | Chelsea | 160502 | 4,460 | 62 |
| 33 | Methuen | 2524 | 4,175 | 62 |
| 34 | Providence | 17 | 3,744 | 62 |
| 35 | Providence | 18 | 7,114 | 61 |
| 36 | Central Falls | 111 | 4,176 | 61 |
| 37 | East Boston | 50101 | 5,115 | 61 |
| 38 | Lawrence | 2517 | 5,145 | 61 |
| 39 | Providence | 3 | 7,714 | 60 |
| 40 | Central Falls | 108 | 4,763 | 59 |
Census tracts in the Boston CSA with the highest percentage of residents who identify as Black American:
| Rank | City or Neighborhood | Census Tract | Population | % Black |
|---|---|---|---|---|
| 1 | Mattapan | 101101 | 3,115 | 84 |
| 2 | Mattapan | 101102 | 4,396 | 84 |
| 3 | Mattapan | 101001 | 5,480 | 83 |
| 4 | Mattapan | 1003 | 3,303 | 80 |
| 5 | Mattapan | 1002 | 2,787 | 78 |
| 6 | Mattapan | 101002 | 4,979 | 77 |
| 7 | Dorchester | 923 | 2,893 | 77 |
| 8 | Roxbury | 82 | 2,815 | 74 |
| 9 | Roxbury | 817 | 3,820 | 71 |
| 10 | Hyde Park | 1404 | 7,650 | 71 |
| 11 | Roxbury | 901 | 4,571 | 71 |
| 12 | Dorchester | 919 | 3,860 | 70 |
| 13 | Dorchester | 1004 | 4,865 | 68 |
| 14 | Roxbury | 819 | 3,115 | 66 |
| 15 | Roxbury | 924 | 5,277 | 66 |
| 16 | Roxbury | 818 | 2,898 | 65 |
| 17 | Mattapan | 1001 | 5,510 | 64 |
| 18 | Roxbury | 815 | 2,134 | 62 |
| 19 | Roxbury | 821 | 5,025 | 62 |
| 20 | Roxbury | 803 | 1,769 | 60 |
| 21 | Roxbury | 903 | 3,179 | 58 |
| 22 | Dorchester | 1009 | 4,072 | 58 |
| 23 | Dorchester | 1005 | 5,909 | 55 |
| 24 | Hyde Park | 1403 | 6,382 | 54 |
| 25 | Dorchester | 92 | 4,945 | 54 |
| 26 | Roxbury | 902 | 2,233 | 53 |
| 27 | Dorchester | 918 | 3,452 | 52 |
| 28 | Roxbury | 904 | 3,659 | 52 |
| 29 | Roxbury | 814 | 3,003 | 50 |
| 30 | Roxbury | 80401 | 2,710 | 50 |
| 31 | Roslindale | 140106 | 1,901 | 49 |
| 32 | Dorchester | 917 | 3,069 | 47 |
| 33 | Dorchester | 914 | 2,741 | 46 |
| 34 | Brockton | 5108 | 6,339 | 44 |
| 35 | Roxbury | 805 | 3,096 | 44 |
| 36 | Roxbury | 801 | 3,350 | 43 |
| 37 | Randolph | 420302 | 7,703 | 42 |
| 38 | Roxbury | 813 | 4,760 | 42 |
| 39 | Dorchester | 922 | 3,349 | 42 |
| 40 | Randolph | 420202 | 6,303 | 40 |
Census tracts in the Boston CSA with the highest percentage of residents who identify as Asian American:
| Rank | City or Neighborhood | Census Tract | Population | % Asian |
|---|---|---|---|---|
| 1 | South End | 70402 | 1,723 | 70 |
| 2 | Chinatown | 702 | 5,218 | 58 |
| 3 | Lowell | 3112 | 3,267 | 55 |
| 4 | Lowell | 3118 | 3,513 | 54 |
| 5 | Lowell | 3117 | 5,098 | 47 |
| 6 | Quincy | 417502 | 4,639 | 45 |
| 7 | Quincy | 4172 | 8,182 | 44 |
| 8 | Malden | 3413 | 5,439 | 39 |
| 9 | Lowell | 3113 | 4,057 | 38 |
| 10 | Westborough | 742402 | 3,026 | 38 |
| 11 | Quincy | 417501 | 5,004 | 37 |
| 12 | Cambridge | 353102 | 5,040 | 36 |
| 13 | Quincy | 417802 | 3,150 | 35 |
| 14 | Lowell | 3111 | 2,410 | 34 |
| 15 | Lowell | 3115 | 2,974 | 33 |
| 16 | Dorchester | 92101 | 6,451 | 31 |
| 17 | Quincy | 417601 | 5,196 | 30 |
| 18 | Fenway–Kenmore | 10103 | 4,569 | 29 |
| 19 | Quincy | 4180002 | 7,020 | 28 |
| 20 | Quincy | 417602 | 5,155 | 28 |
| 21 | Chinatown/Leather District/Downtown | 70101 | 5,902 | 27 |
| 22 | Cambridge | 3539 | 7,090 | 27 |
| 23 | Lowell | 3114 | 5,986 | 26 |
| 24 | Lowell | 3116 | 5,295 | 26 |
| 25 | Lowell | 3107 | 4,441 | 26 |
| 26 | Quincy | 4171 | 4,264 | 26 |
| 27 | Dorchester | 916 | 3,138 | 26 |
| 28 | Malden | 3412 | 6,857 | 25 |
| 29 | Malden | 341102 | 4,564 | 25 |
| 30 | Malden | 341101 | 3,675 | 25 |
| 31 | Acton | 363102 | 5,909 | 25 |
| 32 | Dorchester | 911 | 4,861 | 25 |
| 33 | Allston-Brighton | 703 | 2,791 | 24 |
| 34 | Lexington | 3583 | 5,526 | 24 |
| 35 | Quincy | 418004 | 4,280 | 23 |
| 36 | Brookline | 4009 | 3,865 | 22 |
| 37 | Cambridge | 3532 | 4,897 | 22 |
| 38 | Cambridge | 352101 | 1,654 | 22 |
| 39 | Shrewsbury | 7391 | 9,557 | 22 |
| 40 | Westborough | 7612 | 5,780 | 22 |
Census tracts in the Boston CSA with the highest percentage of residents who identify as Irish American:
| City or Neighborhood | Census Tract | Population | % Irish |
|---|---|---|---|
| South Boston | 60101 | 3,106 | 68 |
| Milton | 416400 | 6,069 | 63 |
| Charlestown | 040401 | 2,439 | 63 |
| Dorchester | 1007 | 4,322 | 63 |
| South Boston | 608 | 3,964 | 62 |
| South Boston | 604 | 4,904 | 61 |
| Milton | 416101 | 5,724 | 58 |
| Marshfield | 506204 | 4,886 | 57 |
| Weymouth | 422100 | 5,293 | 57 |
| Quincy | 417801 | 5,443 | 55 |
| Hull | 500101 | 3,702 | 55 |
| Scituate | 505101 | 3,860 | 55 |
| West Roxbury | 130402 | 4,637 | 54 |
| Quincy | 417400 | 2,566 | 53 |
| South Boston | 60301 | 3,076 | 52 |
| Abington | 520100 | 6,458 | 52 |
| Braintree | 419200 | 5,002 | 52 |
| Braintree | 419600 | 6,766 | 52 |
| Abington | 520201 | 3,952 | 52 |
| Pembroke | 508200 | 6,031 | 52 |
Census tracts in the Boston CSA with the highest percentage of residents who identify as Italian American:
| City or Neighborhood | Census Tract | Population | % Italian |
|---|---|---|---|
| Johnston | 012402 | 2,486 | 63 |
| Cranston | 014501 | 5,179 | 58 |
| Johnston | 012500 | 5,490 | 57 |
| Johnston | 012200 | 7,187 | 57 |
| Providence | 011902 | 4,780 | 55 |
| Cranston | 014800 | 5,591 | 55 |
| Saugus | 208102 | 3,343 | 51 |
| Cranston | 014300 | 4,716 | 49 |
| Cranston | 014600 | 6,991 | 49 |
| Cranston | 014502 | 4,096 | 48 |
| Johnston | 012300 | 6,656 | 48 |
| Johnston | 012401 | 6,950 | 48 |
| Stoneham | 337102 | 5,042 | 45 |
| Stoneham | 337202 | 4,849 | 45 |
| Revere | 170200 | 4,564 | 45 |
| Revere | 170502 | 2,818 | 43 |
| Cranston | 013900 | 2,992 | 43 |
| Revere | 170300 | 9,040 | 43 |
| North Providence | 012103 | 2,965 | 43 |
Census tracts in the Boston CSA with the highest percentage of residents who identify as Portuguese American:
| City or Neighborhood | Census Tract | Population | % Portuguese |
|---|---|---|---|
| New Bedford | 652800 | 3,277 | 72 |
| Fall River | 640600 | 4,450 | 69 |
| Dartmouth | 653203 | 5,005 | 65 |
| New Bedford | 652400 | 2,664 | 64 |
| New Bedford | 652000 | 2,676 | 62 |
| Fall River | 640500 | 5,165 | 60 |
| Fall River | 641200 | 2,803 | 59 |
| New Bedford | 650500 | 3,141 | 58 |
| Fall River | 640901 | 5,071 | 58 |
| New Bedford | 650400 | 3,773 | 57 |
| New Bedford | 652500 | 2,589 | 56 |
| East Providence | 010400 | 6,661 | 55 |
| New Bedford | 652300 | 2,870 | 54 |
| Fall River | 641000 | 2,419 | 54 |
| Fall River | 640300 | 3,693 | 53 |
| Westport | 646101 | 7,356 | 53 |
| Fall River | 640700 | 2,900 | 53 |
| Fall River | 640400 | 2,682 | 53 |
| New Bedford | 650101 | 5,753 | 53 |
| Fall River | 640100 | 5,358 | 52 |
Census tracts in the Boston CSA with French or French Canadian listed as first ancestry:
| City or Neighborhood | Census Tract | Population | % French |
|---|---|---|---|
| Woonsocket | 018500 | 2,831 | 66 |
| Woonsocket | 017700 | 3,518 | 61 |
| Woonsocket | 017500 | 3,128 | 59 |
| Woonsocket | 017800 | 2,514 | 58 |
| Burrillville | 013001 | 3,479 | 56 |
| North Smithfield | 012802 | 2,391 | 54 |
| North Smithfield | 012803 | 4,776 | 53 |
| Burrillville | 013002 | 7,539 | 53 |
| North Smithfield | 012801 | 4,800 | 52 |
| Manchester | 002300 | 3,758 | 52 |
| Woonsocket | 017900 | 3,049 | 51 |
| Burrillville | 012900 | 4,937 | 50 |
| Manchester | 000202 | 2,297 | 49 |
| Manchester | 002100 | 4,782 | 49 |
| Woonsocket | 017600 | 2,560 | 49 |
| Manchester | 002600 | 5,746 | 48 |
| Manchester | 002200 | 3,232 | 47 |
| Woonsocket | 018400 | 6,527 | 47 |
| Blackstone | 747101 | 5,110 | 47 |
| Woonsocket | 018000 | 2,680 | 46 |
Largest cities and towns
Cities and towns with a population over 50,000 as of the 2020 census include:
| State capital |
| State largest city |
| Rank | Name | State | Population (2020) | Population (2010) | Change |
|---|---|---|---|---|---|
| 1. | Boston | 675,647 | 617,594 | +9.40% | |
| 2. | Worcester | 206,518 | 181,045 | +14.07% | |
| 3. | Providence | 190,934 | 178,042 | +7.24% | |
| 4. | Cambridge | 118,403 | 105,162 | +12.59% | |
| 5. | Manchester | 115,644 | 109,565 | +5.55% | |
| 6. | Lowell | 115,554 | 106,519 | +8.48% | |
| 7. | Brockton | 105,643 | 93,810 | +12.61% | |
| 8. | Quincy | 101,636 | 92,271 | +10.15% | |
| 9. | Lynn | 101,253 | 90,329 | +12.09% | |
| 10. | New Bedford | 101,079 | 95,072 | +6.32% | |
| 11. | Fall River | 94,000 | 88,857 | +5.79% | |
| 12. | Nashua | 91,322 | 86,494 | +5.58% | |
| 13. | Lawrence | 89,143 | 76,377 | +16.71% | |
| 14. | Newton | 88,923 | 85,146 | +4.44% | |
| 15. | Cranston | 82,934 | 80,387 | +3.17% | |
| 16. | Warwick | 82,823 | 82,672 | +0.18% | |
| 17. | Somerville | 81,045 | 75,754 | +6.98% | |
| 18. | Pawtucket | 75,604 | 71,148 | +6.26% | |
| 19. | Framingham | 72,362 | 68,318 | +5.92% | |
| 20. | Haverhill | 67,787 | 60,879 | +11.35% | |
| 21. | Malden | 66,263 | 59,450 | +11.46% | |
| 22. | Waltham | 65,218 | 60,632 | +7.56% | |
| 23. | Brookline | 63,191 | 58,732 | +7.59% | |
| 24. | Revere | 62,186 | 51,755 | +20.15% | |
| 25. | Plymouth | 61,217 | 56,468 | +8.41% | |
| 26. | Medford | 59,659 | 56,173 | +6.21% | |
| 27. | Taunton | 59,408 | 55,874 | +6.32% | |
| 28. | Weymouth | 57,437 | 53,743 | +6.87% | |
| 29. | Peabody | 54,481 | 51,251 | +6.30% | |
| 30. | Methuen | 53,059 | 47,255 | +12.28% |
Education
A long established center of higher education, the area includes many community colleges, two-year schools, and internationally prominent undergraduate and graduate institutions. The graduate schools include highly regarded schools of law, medicine, business, technology, international relations, public health, education, and religion. Greater Boston contains seven R1 Research Institutions as per the Carnegie Classification of Institutions of Higher Education. This is, by far, the highest number of such institutions in a single Metropolitan Statistical Area in the United States.
Economy
Major companies
References:
|
Transportation
Interstates
- I-90
- I-93
- I-95
- I-190
- I-195
- I-290
- I-293
- I-295
- I-395
- I-495
U.S. Routes
- US 1
- US 3
- US 6
- US 20
- US 44
State Highways
- Route 1A
- Route 2
- Route 2A
- Route 3
- Route 3A
- Route 4
- Route 9
- Route 16
- Route 18
- Route 24
- Route 25
- Route 27
- Route 28
- Route 30
- Route 38
- Route 53
- Route 58
- Route 60
- Route 62
- Route 97
- Route 106
- Route 109
- Route 110
- Route 113
- Route 114
- Route 115
- Route 117
- Route 122
- Route 123
- Route 125
- Route 126
- Route 128
- Route 129
- Route 133
- Route 135
- Route 138
- Route 139
- Route 140
- Route 145
- Route 146
- Route 213
- Route 225
Bridges and tunnels
- Boston University Bridge, carrying Route 2
- Callahan Tunnel, carrying Route 1A Northbound
- Charles M. Braga Jr. Memorial Bridge, carrying Interstate 195
- Claiborne Pell Newport Bridge, carrying Route 138
- Fore River Bridge, carrying Massachusetts Route 3A
- Harvard Bridge, carrying Route 2A
- Longfellow Bridge, carrying Massachusetts Route 3, US Route 3, and the MBTA Red Line
- William Felton "Bill" Russell Bridge, carrying Route 99
- Sumner Tunnel, carrying Route 1A Southbound
- Ted Williams Tunnel, carrying I-90
- Thomas P. O'Neill Jr. Tunnel, carrying I-93 and Routes 1 and 3 concurrently
- Tobin Bridge, carrying Route 1
- Zakim Bunker Hill Bridge, carrying Interstate 93, Route 1 and Route 3 concurrently
Airports
- Logan International Airport in Boston, 3 miles (4.8 km) northeast of downtown Boston, New England's largest transportation center
- Manchester–Boston Regional Airport in Manchester, New Hampshire
- T. F. Green Airport in Warwick, Rhode Island
- Hanscom Field in Bedford
- Norwood Memorial Airport
- Worcester Regional Airport
- Beverly Regional Airport
- Lawrence Municipal Airport
Rail and bus
The Massachusetts Bay Transportation Authority (MBTA) is the primary operator of transit in Greater Boston. It operates the MBTA subway system and the MBTA bus network in Boston and inner suburbs, as well as the MBTA Commuter Rail system and the MBTA ferry network serving Greater Boston.
Other public transit includes Amtrak intercity rail service, Logan Express service to Logan International Airport, and privately-operated intercity bus and ferry systems. A number of regional transit authorities operate local bus service:
- Brockton Area Transit Authority
- Cape Ann Transportation Authority
- Greater Attleboro Taunton Regional Transit Authority
- Lowell Regional Transit Authority
- Merrimack Valley Regional Transit Authority
- MetroWest Regional Transit Authority
- Montachusett Regional Transit Authority
- Rhode Island Public Transit Authority
- Worcester Regional Transit Authority
Ocean transportation
- Port of Boston (Massport)
- Cape Cod Canal
Sports
| Club | Sport | League | Stadium | Established | League titles |
|---|---|---|---|---|---|
| Boston Bruins | Ice hockey | National Hockey League | TD Garden (Boston) | 1924 | 6 Stanley Cups 7 Eastern Conference Titles |
| Boston Celtics | Basketball | National Basketball Association | TD Garden (Boston) | 1946 | 18 NBA Championships 23 Eastern Conference Titles |
| Boston Red Sox | Baseball | Major League Baseball | Fenway Park (Boston) | 1901 | 9 MLB World Series Championships 14 American League Pennants |
| New England Patriots | Football | National Football League | Gillette Stadium (Foxboro) | 1960 | 6 Super Bowl Championships 11 AFC Championships |
| New England Revolution | Soccer | Major League Soccer | Gillette Stadium (Foxboro) | 1996 | 1 US Open Cup 1 Supporters' Shield |
| New England Free Jacks | Rugby union | Major League Rugby | Veterans Memorial Stadium (Quincy) | 2018 | 2 MLR Championships |
Annual sporting events include:
- The Boston Marathon, which follows a course from Hopkinton to Boston
- The Head of the Charles Regatta
- The Lenox Industrial Tools 301, Sylvania 300 and New Hampshire Indy 225 auto races at the New Hampshire Motor Speedway oval track.
The Greater Boston League, a high school athletic conference in Massachusetts.
wikipedia, wiki, encyclopedia, book, article, read, free download, Information about greater boston. What is greater boston? What does greater boston mean?